How's it flowing?
Explore the findings. Understand the challenges. Be part of the solution.
From the smallest creek to vast rivers and lakes, every drop is part of a shared system that sustains life. The Watershed Reports help us understand how our waters are doing—where they’re healthy, where they’re struggling, and what needs to change.
5 basins flowing into the ocean ⇢ 11 watersheds ⇢ formed of 164 subwatersheds
Ready to Dive in ?
Popover content
Click on the target (lower right) to geo-locate yourself to your watershed.
Datapoints
This analysis includes all the data we could access—whether from open platforms, agency reports, or historical records. Some datasets were readily available, while others came from hardcopy reports and handwritten notes that we digitized and formatted. We’re grateful to all data providers for sharing their data. Even so, this is only part of the picture. Learn more about data accessibility challenges.
20 million
12.7 million
>575,000
>650,000
Insights That Empower.
Data That Drives Action.
overall score = water quality + Flow + Benthic invertebrates + Fish
We’ve calculated a freshwater health score for each watershed. But to truly understand what’s happening beneath the surface, we also dive deeper into the four key indicators: water quality, hydrology, fish, and benthic invertebrates. These indicators each highlight different aspects of freshwater health and bring their own complexities, including potential monitoring bias That’s why, beyond the overall score, we’re shining a light on the standout trends, surprising patterns, fish and invertebrate species, and key takeaways that emerged from the data.
What is a watershed?
A watershed is an area of land where all the water—like rain, snowmelt, and streams—drains into a common body of water, such as a river, lake, or ocean. Learn more about watersheds here.
Canada’s freshwater systems are structured in a natural hierarchy of watersheds. Water across the country flows into five major drainage basins, directing water north (the Arctic Ocean, Hudson Bay), east (Atlantic), west (Pacific) and south (Gulf of Mexico). These drainage basins break down further into 11 major watersheds, which in turn divide into 164 subwatersheds and 974 sub-sub watersheds.
In our assessment, we’ve evaluated freshwater health at every level: from the 5 major basins to the 11 watersheds, all the way down to the 164 subwatersheds.
While local-scale insights provide the most actionable data, it is also essential to evaluate freshwater health at a national level. By examining trends across multiple scales, we can better understand the broader challenges and successes in water management across Canada.
About the scores
Each watershed in Canada receives a freshwater health score based on four key indicators: water quality, hydrology (water flow), fish populations, and benthic invertebrates. These scores offer critical insight into the health of Canada’s rivers and streams, where data exists, is accessible, and usable. However, one of the most striking findings of this assessment is how much remains unknown. Across the 11 major watersheds, 72% were classified as data deficient, meaning insufficient information was available to confidently assess their overall health. The pattern is similar at the sub-watershed level: 75.6% of Canada’s 164 sub-watersheds are data deficient. While some watersheds scored “Good” or “Very Good”—notably, 9.1% of major watersheds and 19% of sub-watersheds achieved these ratings—the prevalence of data deficiency highlights an urgent gap in long-term, accessible freshwater monitoring.
But identifying these gaps is part of the story. Each watershed’s score is paired with a data sufficiency rating, making it clear where data is robust and where caution is needed. This isn’t just a limitation—it’s a roadmap. By showing where water quality, hydrology, fish, and benthic invertebrates data are lacking, the assessment points to specific regions and indicators that need focused attention. In particular, fish data and benthic invertebrate data were often the most incomplete—over 86% of sub-watersheds lacked sufficient fish data, and nearly 69% lacked benthic scores due to data limitations as well as a a lack of appropriate tolerance values for certain regions, making it impossible to generate reliable scores.
Recognizing these deficiencies is crucial: it allows us to better target future investments, strengthen community and institutional monitoring efforts, helping ensure that even historically under-monitored or remote regions aren’t left out of future freshwater health efforts.
Water quality
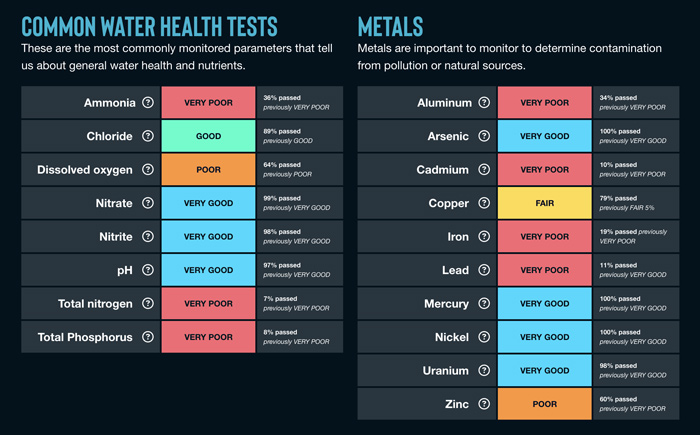
We assess freshwater quality by measuring key parameters—such as metals, nutrients, and pollutants— against federal, provincial, and territorial guidelines to determine its suitability for aquatic life.
Water quality is one of the most commonly monitored indicators of freshwater health, influencing aquatic life, recreation, and drinking water safety. Our water quality score looks at multiple key parameters to provide an overall assessment, helping us understand where conditions support healthy ecosystems and where concerns exist. However, we were only able to provide scores for 47% of subwatersheds.
Plus, no single score can capture all the details. That’s why we also provide a breakdown of individual water quality parameters—highlighting six key ones at the watershed level and all 47 at the sub-watershed level. This approach helps reveal specific issues, such as high nutrient levels or metal contamination, that might otherwise be masked in the overall score.
For example, we couldn’t calculate a water quality score for Northern Lake Erie because it didn’t meet the minimum data sufficiency requirements. But looking at individual parameters, we see that ammonia, total phosphorus, and total nitrogen levels are rated Very Poor, indicating significant pollution concerns.
How's the phosphorus?
Parameters like total phosphorus are often monitored because of its association with eutrophication
For phosphorus, 51% of subwatersheds were ‘data-deficient’, 37% scored ‘very poor’, and 9% scored ‘poor’. None received a ‘good’ score. As with all data, these scores may represent sampling bias as we expect that data collectors would focus monitoring efforts on areas of concern.
Flow
We assess freshwater flow by analyzing long-term hydrometric data from monitoring stations across Canada
We assessed hydrology using long-term flow data from HYDAT, selecting stations with at least 50 years of records and sufficient daily flow data. To detect long-term changes, we compared average daily flows across two 30-year periods (1964–1993 and 1994–2023).
In the Upper Liard sub-watershed, data from three stations dating back to 1960 showed no detectable change in flow patterns over time. This earned Upper Liard a very good hydrology score (5) and a moderately sufficient data sufficiency rating.
What our total daily flow looks like
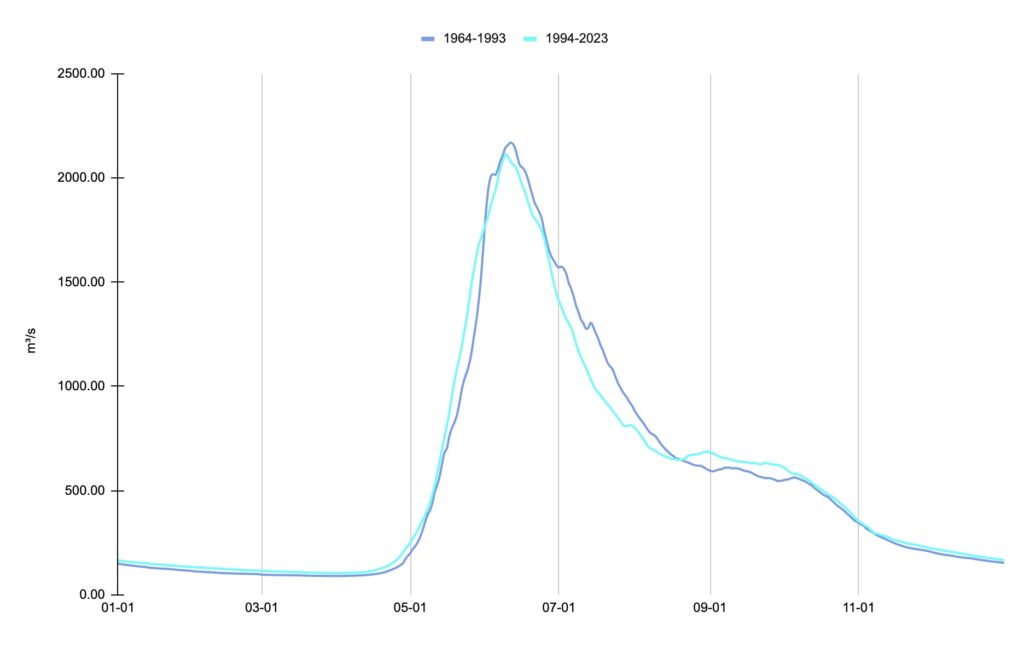
Upper Liard subwatershed (in northern British Columbia and Yukon) total daily flow 1994–2023 vs. 1964–1993
benthic Invertebrates
We evaluate benthic invertebrates, measuring their pollution tolerance to assess long-term water quality and ecosystem health

Benthic invertebrates are key indicators of freshwater health, but scoring them is challenging due to missing data and regional variability. At the major watershed level, 27.3% were data deficient and over half (54.5%) couldn’t be scored; at the sub-watershed level, 68.9% were not scored. We used the Hilsenhoff Biotic Index (HBI), though its effectiveness varies—especially in northern and prairie regions, where natural conditions can skew results.
An example is the Upper Athabasca sub-watershed, data from 22 sites (since 2002) yielded an HBI score of 3.42, indicating low organic pollution and earning a very Good (5) rating. Data sufficiency was classified as moderately sufficient.
The most commonly reported taxa:
Non-biting midges (Chironomidae)
Chironomidae, or non-biting midges, are the most common benthic invertebrates in much of Canadian freshwaters. With over 10,000 species worldwide, they are a diverse family of insects with the ability to live in environments ranging in temperature, oxygen levels, and salinity. Dig into each watershed for the most common invertebrate (and the proportion of the total)!
Fish
We assess fish populations by measuring native species richness to gauge ecosystem health, biodiversity, and habitat impacts.

Fish populations reflect long-term aquatic health, yet getting enough data is a significant challenge. At the sub-watershed level, 86% were data deficient, with only 14% receiving a good rating.
These findings underscore the importance of increasing fish monitoring to ensure a more complete understanding of freshwater ecosystems across Canada.
Blueback salmon
Most commonly reported fish species
We were so impressed with the use of technology, emerging methods, statistical models by the Pacific Salmon Commission, who reported 94 million individual records for the Blueback Salmon over the past 10 years! These records are represented in Reports for the Pacific Basin (for both the Pacific watershed and Yukon River watershed).
Summary of scores from the major basins
Explore all the sub-watersheds within the basins. Each sub-watershed includes its freshwater health score, with detailed breakdowns and trend analyses for water quality, flow, benthic invertebrates, and fish. Click on any sub-watershed to dive deeper into the indicators for each and see how conditions are changing over time.
Very good | Good | Fair | Poor | Very poor | Data deficient | Not scored |
Divided into... | Overall health | Water quality | Flow | Invertebrates | Fish | |
|---|---|---|---|---|---|---|
Flowing South Gulf of MexicoData deficient (Insufficient) | ||||||
Flowing West Pacific OceanVery good (Partially Sufficient) | ||||||
Flowing North Hudson BayData deficient (Insufficient) | ||||||
Flowing North Arctic OceanData deficient (Insufficient) | ||||||
Flowing East Atlantic OceanFair (Partially Sufficient) | ||||||
Celebrate data successes
78% of water quality data sourced from DataStream
Since the last Watershed Reports were published in 2017 and 2020, DataStream has expanded into new regions, significantly enhancing access to water quality data collected by hundreds of monitoring groups across Canada. Their growth has been instrumental in allowing us to incorporate a much larger dataset, strengthening the size and richness of the water quality data used in this report. We are grateful for their contributions to advancing open data for freshwater health.
100% of flow data is from the National Water Data Archive
HYDAT is Canada’s essential archival database for hydrology, providing vital data on daily and monthly mean flow, water levels, and sediment concentration from over 2,500 active and 5,500 discontinued monitoring stations. Complementing it, HYDEX offers crucial inventory details on these stations, including their location, equipment, and data types — together forming the backbone of Canada’s national hydrometric information.
Compiling data from multiple sources
We recognize the invaluable contributions of initiatives like the Canadian Aquatic Biomonitoring Network (CABIN) led by Environment and Climate Change Canada, the Columbia Basin Water Hub by Living Lakes Canada, and the Living Planet Index developed by the Zoological Society of London in partnership with WWF. These programs compile data from numerous sources, making it more accessible and improving our ability to assess freshwater health across Canada. Centralizing and standardizing monitoring data helps build a more complete picture of aquatic ecosystems.
What are we missing?
76% of subwatersheds are data deficient
Distribution of overall health scores shows how massive data deficiency is.
-
Data gaps limit understanding – We couldn’t assess 75.6% of subwatersheds, leaving major blind spots in freshwater health.
-
Collaboration is essential – The assessment relied on data from all sector and many exciting multi-organizational collaborations. Open-data platforms like DataStream and CABIN made all the difference.
-
We need a unified framework – Without a common, science-based approach to evaluating freshwater health, water management remains fragmented and inconsistent.
-
Better tools, better insights – More consistent, accessible assessments of fish, benthics, hydrology, and water quality—plus modernized monitoring methods—are key to future progress.
Explore our big takeaways for deeper insights.
Looking to the future
(Get your Waders on!)
Collaboration is power – Working together makes water monitoring more effective. Long-term programs and open-data platforms like DataStream and CABIN help fill critical gaps.
A higher standard for water protection – A unified, science-based framework is needed to guide freshwater health assessments, with standardized methods and sustained investment.
Hope fuels action – While challenges exist, we must also highlight conservation successes to inspire progress!
Modern tools for modern challenges – Better data collection, accessibility, and transparent scoring systems will help us make informed decisions for healthier waters.
Dive into our recommendations and calls to action. Let’s build a stronger vision for the future of freshwater together!
Powered by…
Thanks to AquaAction for supporting these Reports and their tireless support in water innovation!

Proudly wear our beautiful rivers!
We think our rivers are so beautiful. All proceeds support server costs for this website and Water Rangers free open data platform.
 View t-shirts
Our How’s it Flowing unisex t-shirts are printed in Canada on cotton and shipped from our Water Rangers store (shipping is included).
 View other available items
We have curated a small collection of items on Redbubble.ca. Please note that they ship some items from other countries and you may have to pay customs duties.